Expert
Chrome developers tools
Chrome developers tools
take heap spanshot
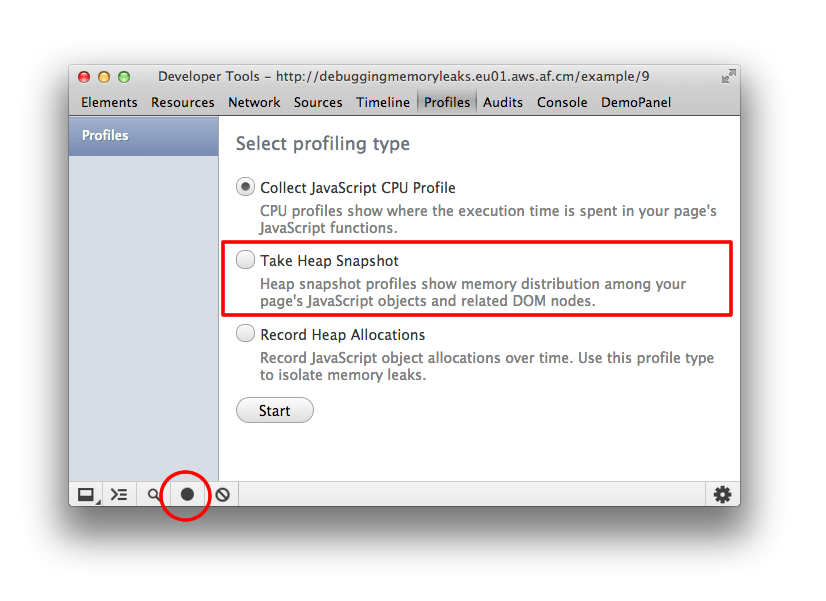
On the Profiles panel, choose Take Heap Snapshot, then click Start or press Cmd + E or Ctrl + E:
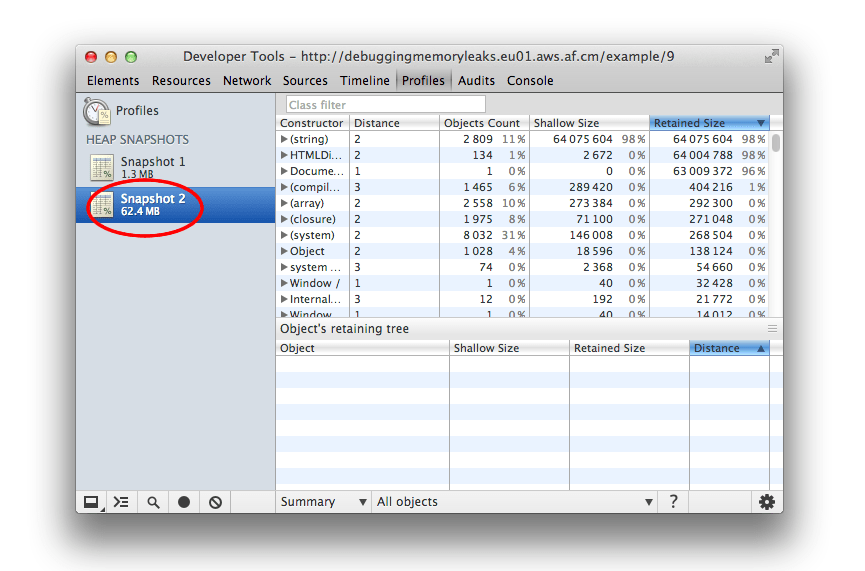
Snapshots are initially stored in the renderer process memory. They are transferred to the DevTools on demand, when you click on the snapshot icon to view it.
After the snapshot has been loaded into DevTools and has been parsed, the number below the snapshot title appears and shows the total size of the reachable JavaScript objects:
View snapshots
View snapshots from different perspectives for different tasks.
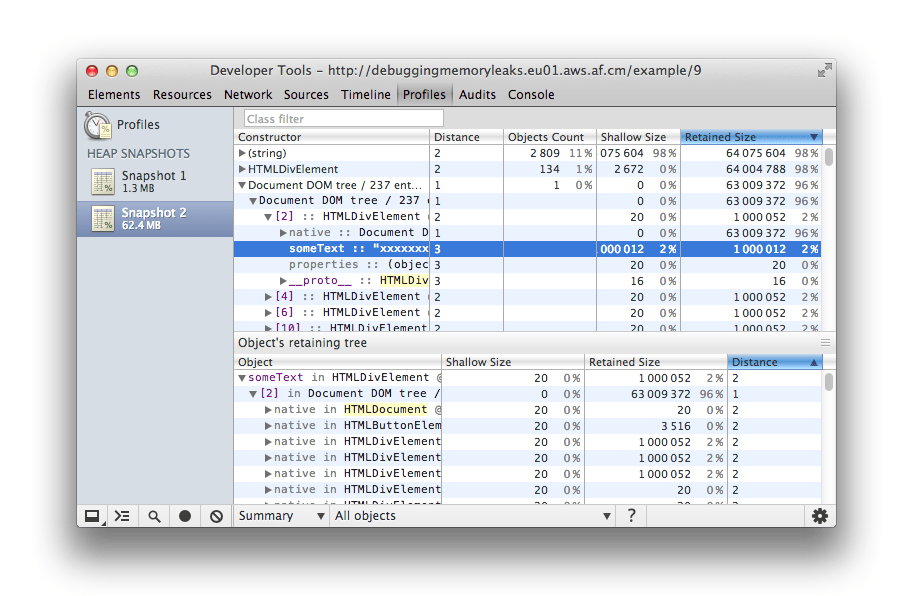
Summary view shows objects grouped by the constructor name. Use it to hunt down objects (and their memory use) based on type grouped by constructor name. It's particularly helpful for tracking down DOM leaks.
Initially, a snapshot opens in the Summary view, displaying object totals, which can be expanded to show instances
Comparison view displays difference between two snapshots. Use it to compare two (or more) memory snapshots of before and after an operation. Inspecting the delta in freed memory and reference count lets you confirm the presence and cause of a memory leak.
Containment view allows exploration of heap contents. It provides a better view of object structure, helping analyze objects referenced in the global namespace (window) to find out what is keeping them around. Use it to analyze closures and dive into your objects at a low level.
Dominators view shows the dominators tree and can be useful to find accumulation points. This view helps confirm that no unexpected references to objects are still hanging around and that deletion/garbage collection is actually working.
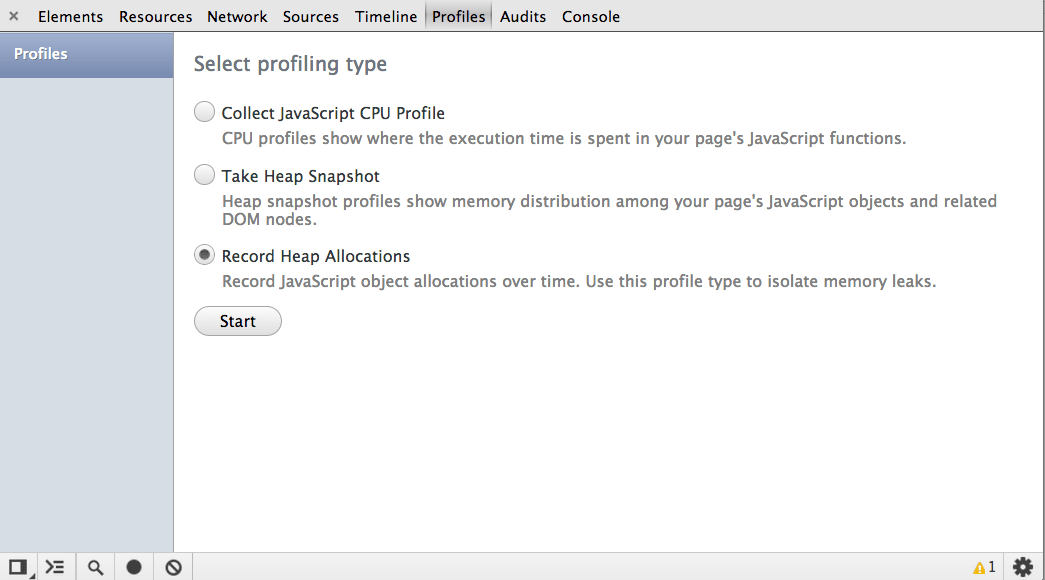
record heap allocations
The allocation profiler combines the detailed snapshot information of the heap profiler with the incremental updating and tracking of the Timeline panel. Similar to these tools, tracking objects’ heap allocation involves starting a recording, performing a sequence of actions, then stop the recording for analysis.
The tool takes heap snapshots periodically throughout the recording (as frequently as every 50 ms!) and one final snapshot at the end of the recording.
![]()
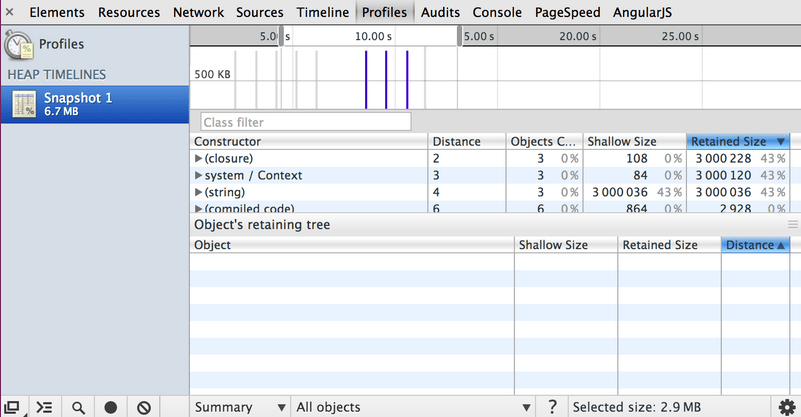
Read a heap allocation profile
The heap allocation profile shows where objects are being created and identifies the retaining path. In the snapshot below, the bars at the top indicate when new objects are found in the heap.
The height of each bar corresponds to the size of the recently allocated objects, and the color of the bars indicate whether or not those objects are still live in the final heap snapshot. Blue bars indicate objects that are still live at the end of the timeline, Gray bars indicate objects that were allocated during the timeline, but have since been garbage collected:
using Audits page
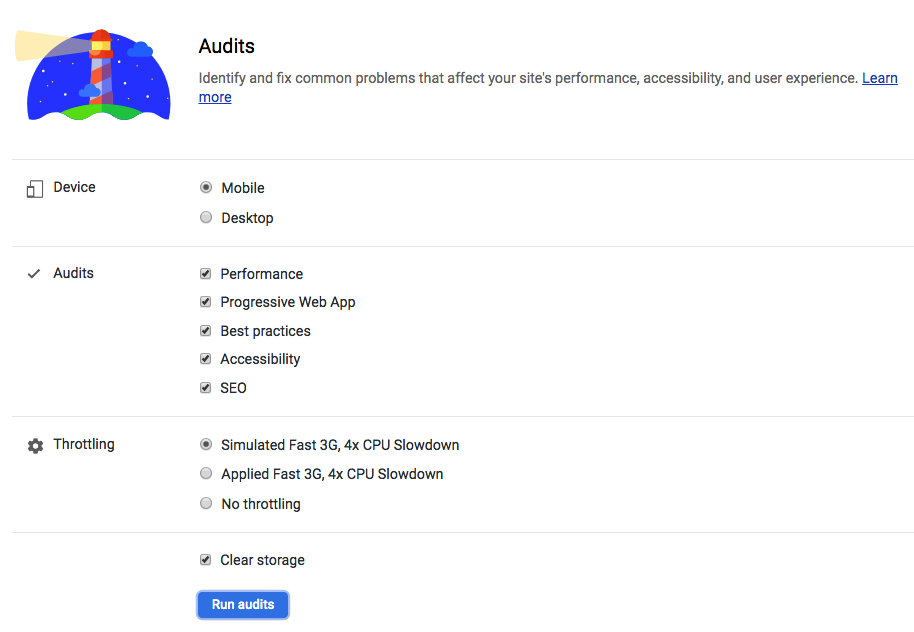
Lighthouse
Lighthouse is an open-source, automated tool for improving the quality of web pages. You can run it against any web page, public or requiring authentication. It has audits for performance, accessibility, progressive web apps, and more.
CI (teamcity/hudson/jenkins/strider)
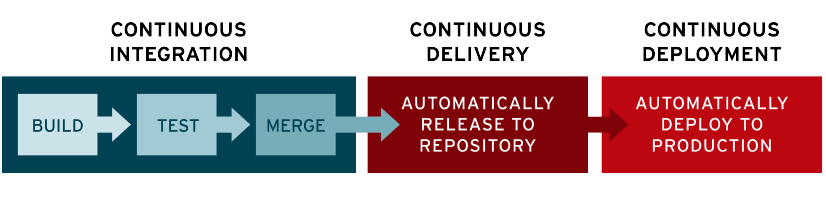
Continuous integration
In modern application development, the goal is to have multiple developers working simultaneously on different features of the same app. However, if an organization is set up to merge all branching source code together on one day (known as “merge day”), the resulting work can be tedious, manual, and time-intensive. That’s because when a developer working in isolation makes a change to an application, there’s a chance it will conflict with different changes being simultaneously made by other developers.
Continuous integration (CI) helps developers merge their code changes back to a shared branch, or “trunk,” more frequently—sometimes even daily. Once a developer’s changes to an application are merged, those changes are validated by automatically building the application and running different levels of automated testing, typically unit and integration tests, to ensure the changes haven’t broken the app. This means testing everything from classes and function to the different modules that comprise the entire app. If automated testing discovers a conflict between new and existing code, CI makes it easier to fix those bugs quickly and often.
Continuous delivery
Following the automation of builds and unit and integration testing in CI, continuous delivery automates the release of that validated code to a repository. So, in order to have an effective continuous delivery process, it’s important that CI is already built into your development pipeline. The goal of continuous delivery is to have a codebase that is always ready for deployment to a production environment.
In continuous delivery, every stage—from the merger of code changes to the delivery of production-ready builds—involves test automation and code release automation. At the end of that process, the operations team is able to deploy an app to production quickly and easily.
Continuous deployment
The final stage of a mature CI/CD pipeline is continuous deployment. As an extension of continuous delivery, which automates the release of a production-ready build to a code repository, continuous deployment automates releasing an app to production. Because there is no manual gate at the stage of the pipeline before production, continuous deployment relies heavily on well-designed test automation.
In practice, continuous deployment means that a developer’s change to an application could go live within minutes of writing it (assuming it passes automated testing). This makes it much easier to continuously receive and incorporate user feedback. Taken together, all of these connected CI/CD practices make deployment of an application less risky, whereby it’s easier to release changes to apps in small pieces, rather than all at once. There’s also a lot of upfront investment, though, since automated tests will need to be written to accommodate a variety of testing and release stages in the CI/CD pipeline.
По сути, это просто подход к разработке программного обеспечения:
Continuous Integration подразумевает частые автоматизированные сборки проекта с целью быстрого выявления интеграционных проблем. У вас всегда будет актуальная и готовая к тестам версия продукта.
Continuous Delivery предполагает частую доставку обновлений на «боевую» систему. Продукт поддерживается в актуальной версии, а любые ошибки при обновлении проще отследить, так как при каждом релизе объем изменений невелик.
CI/CD is short for Continuous Integration/ Continuous Delivery / Continuous Deployment. It enables teams to build, test and release software at a faster rate. CI/CD removes manual human interactions where possible - automating everything except the final manual code deployment to production. One of the challenges of implementing this practice is integrating the various tools and systems required to build a CI/CD pipeline. For example, you might store your code in Bitbucket, test it in automated test suites on private infrastructure, and deploy your application to AWS or Microsoft Azure. Complicated applications residing on multiple systems have contributed to not all organizations implementing a seamless CI/CD pipeline.
Scenario
Scenario Let's say we have a Node.js API that retrieves a list of books in a database. We can create a pipeline that pushes our code through three phases: build, test and deploy. A pipeline is a group of steps that are grouped by similar characteristics. With those phases our pipeline is defined by three types:
- Project Pipeline
- Continuous Integration Pipeline
- Deploy Pipeline
The Project Pipeline installs dependencies, runs linters and any scripts that deal with the code. The Continuous Integration Pipeline runs automated tests and builds a distributed version of the code. Finally, the Deploy Pipeline deploys code to a designated cloud provider and environment.
The steps that the three pipelines execute are called jobs. When you group a series of jobs by those characteristics it is called stages. Jobs are the basic building block for pipelines. They can be grouped together in stages and stages can be grouped together into pipelines. Here's an example hierarchy of jobs, stages, and pipelines:
A.) Build
     i. Install NPM Dependencies
     ii. Run ES-Linter
     iii. Run Code-Minifier
B.) Test
     i. Run unit, functional and end-to-end test.
     ii. Run pkg to compile Node.js application
C.) Deploy
     i. Production
        1.) Launch EC2 instance on AWS
     ii. Staging
        1.) Launch on local development server
In this hierarchy, all three components are considered three different pipelines. The main bullets -- build, test, and deploy are stages and each bullet under those sections are jobs. Let's break this out into a GitLab CI/CD yaml file.
To use GitLab CI/CD, create a file called .gitlab-ci.yml at the root of the project in your GitLab repository and add the following yaml:
image: node:10.5.0

stages:
  - build
  - test
  - deploy

before_script:
  - npm install
As I mentioned earlier, GitLab CI/CD uses Runners to execute pipelines. We can define which operating system and predefined libraries we would want our Runner to be based off by using the image directive. In our instance, we will be using the latest version of Node.js for our Runner. The stages directive allows us to predefine a stage for the entire configuration. Jobs will be executed based off of the order listed in the stages directive.The before_script directive is used to run a command before all jobs.
Now let's start with our job dedicated to the Build stage. We are going to call this job build-min-code. In this job we want it to install dependencies and minify the code. We can start this off with using the script directive. The script directive is a shell script that gets executed within the Runner. Then we are going to assign this job to the "build" stage. To assign a job to a stage, use the stage directive.
build-min-code:
  stage: build
  script:
    - npm install
    - npm run minifier
Now we have a job associated with our Build stage and we are going to do that for our Test stage. Our test job is going to be called run-unit-test and we are going to use the npm script in our API to run a test npm test.
run-unit-test:
  stage: test
  script:
    - npm run test
Finally, we are going to add a job to handle our Deploy stage: deploy-production, deploy-staging. In this instance, we are going to have two different jobs for deployment (staging and production). These jobs will reflect the same layout as our previous jobs but with a small change. Currently, all of our jobs are automatically set to be triggered on any code push or branch. We do not want to have that for when we deploy our code to staging and production. To prevent that from happening we use the only directive. The only directive defines the names of branches and tags for which the job will run. The job will look like the following:
deploy-staging:
 stage: deploy
 script:
   - npm run deploy-stage
 only:
   - develop

deploy-production:
 stage: deploy
 script:
   - npm run deploy-prod
 only:
   - master
In our deploy-staging job, the Runner will only execute it if there was a change to the develop branch and for deploy-production the master branch. Here is a screenshot below that shows a code push made to the master branch.
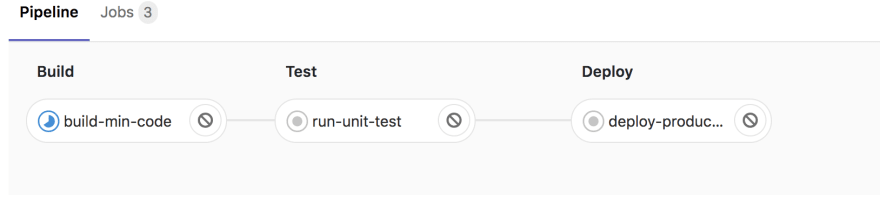
From this image, all three stages and jobs are triggered with the exception of deploy-staging since the code push was to the master branch. GitLab CI/CD comes with an intuitive interface to help show what jobs and stages are running and what errors are occurring in the midst of the build. Below is the final version of the .gitlab-ci.yaml file.
image: node:10.5.0

stages:
  - build
  - test
  - deploy

before_script:
  - npm install

build-min-code:
  stage: build
  script:
    - npm install
    - npm run minifier

run-unit-test:
  stage: test
  script:
    - npm run test

deploy-staging:
  stage: deploy
  script:
    - npm run deploy-stage
  only:
    - develop

deploy-production:
  stage: deploy
  script:
    - npm run deploy-prod
  only:
    - master
Configure
| Keyword | Description |
|---|---|
script | Shell script which is executed by Runner. |
image | Use docker images. Also available: image:name and image:entrypoint. |
services | Use docker services images. Also available: services:name, services:alias, services:entrypoint, and services:command. |
before_script | Override a set of commands that are executed before job. |
after_script | Override a set of commands that are executed after job. |
stages | Define stages in a pipeline. |
stage | Defines a job stage (default: test). |
only | Limit when jobs are created. Also available: only:refs, only:kubernetes, only:variables, and only:changes. |
except | Limit when jobs are not created. Also available: except:refs, except:kubernetes, except:variables, and except:changes. |
tags | List of tags which are used to select Runner. |
allow_failure | Allow job to fail. Failed job doesn’t contribute to commit status. |
when | When to run job. Also available: when:manual and when:delayed. |
environment | Name of an environment to which the job deploys. Also available: environment:name, environment:url, environment:on_stop, and environment:action. |
cache | List of files that should be cached between subsequent runs. Also available: cache:paths, cache:key, cache:untracked, and cache:policy. |
artifacts | List of files and directories to attach to a job on success. Also available: artifacts:paths, artifacts:name, artifacts:untracked, artifacts:when, artifacts:expire_in, artifacts:reports, and artifacts:reports:junit.In GitLab Enterprise Edition, these are available: artifacts:reports:codequality, artifacts:reports:sast, artifacts:reports:dependency_scanning, artifacts:reports:container_scanning, artifacts:reports:dast, artifacts:reports:license_management, artifacts:reports:performance and artifacts:reports:metrics. |
dependencies | Other jobs that a job depends on so that you can pass artifacts between them. |
coverage | Code coverage settings for a given job. |
retry | When and how many times a job can be auto-retried in case of a failure. |
parallel | How many instances of a job should be run in parallel. |
trigger | Defines a downstream pipeline trigger. |
include | Allows this job to include external YAML files. Also available: include:local, include:file, include:template, and include:remote. |
extends | Configuration entry that this job is going to inherit from. |
pages | Upload the result of a job to use with GitLab Pages. |
variables | Define job variables on a job level. |
- script is the only required keyword that a job needs. It’s a shell script which is executed by the Runner
- image used to specify a Docker image to use for the job
- services used to specify a service Docker image, linked to a base image specified in image.
- before_script is used to define the command that should be run before all jobs, including deploy jobs, but after the restoration of artifacts. This can be an array or a multi-line string.
- after_script is used to define the command that will be run after all jobs, including failed ones. This has to be an array or a multi-line string.
- stages is used to define stages that can be used by jobs and is defined globally.
- only defines the names of branches and tags for which the job will run.
- except defines the names of branches and tags for which the job will not run.
принципы CI/CD.
- Первый принцип CI/CD: сегрегация ответственности заинтересованных сторон.
- Второй принцип CI/CD: снижение риска.
- Третий принцип CI/CD: короткий цикл обратной связи.
PSI
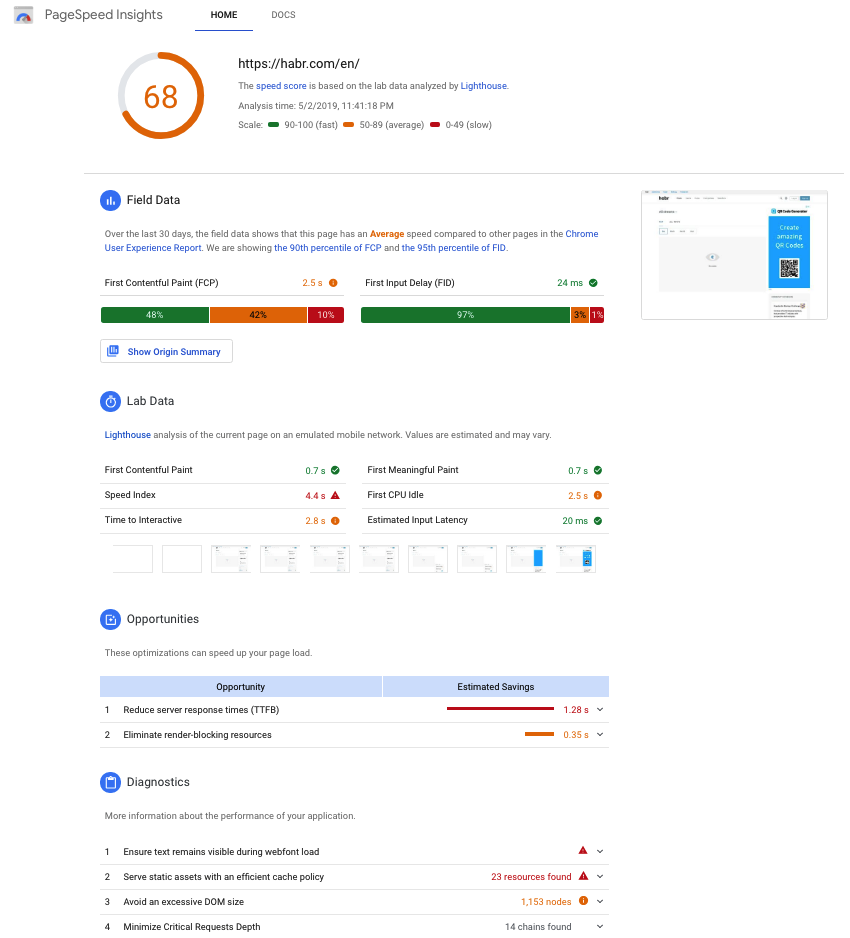
PageSpeed Insights (PSI) reports on the performance of a page on both mobile and desktop devices, and provides suggestions on how that page may be improved.
PSI provides both lab and field data about a page. Lab data is useful for debugging performance issues, as it is collected in a controlled environment. However, it may not capture real-world bottlenecks. Field data is useful for capturing true, real-world user experience - but has a more limited set of metrics.
bennefits of using
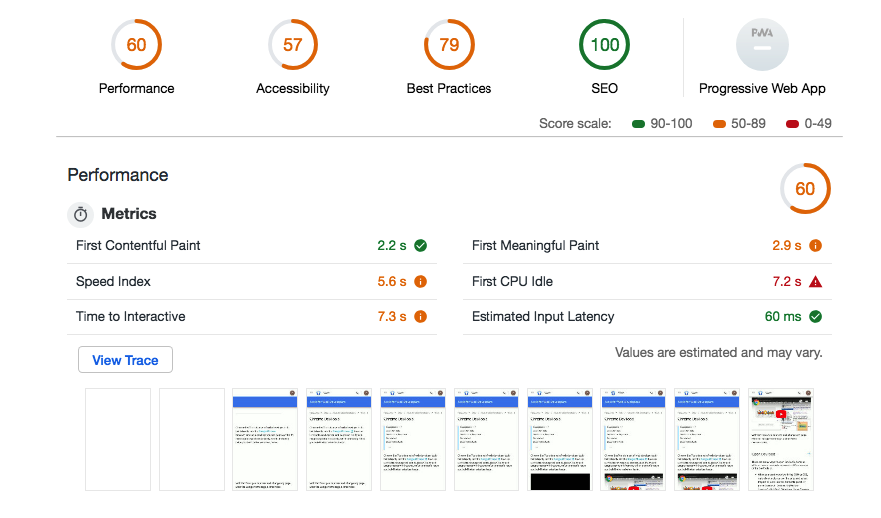
Performance score
At the top of the report, PSI provides a score which summarizes the page’s performance. This score is determined by running Lighthouse to collect and analyze lab data about the page. A score of 90 or above is considered fast, and 50 to 90 is considered average. Below 50 is considered to be slow.
Distribution and selected value of FCP and FID
PSI presents a distribution of these metrics so that developers can understand the range of FCP and FID values for that page or origin. This distribution is also split into three categories: Fast, Average, and Slow, denoted with green, orange, and red bars. For example, seeing 14% within FCP's orange bar indicates that 14% of all observed FCP values fall between 1,000ms and 2,500ms. This data represents an aggregate view of all page loads over the previous 30 days.
Above the distribution bars, PSI reports the 90th percentile First Contentful Paint and the 95th percentile First Input Delay, presented in seconds and milliseconds respectfully. These percentiles are selected so that developers can understand the most frustrating user experiences on their site. These field metric values are classified as fast/average/slow by applying the same thresholds shown above.
Use the PageSpeed Insights API to:
- Measure the performance of a web page.
- Get suggestions on how to improve the page's performance, accessibility, and SEO.
- Learn how to convert the page into a Progressive Web App.
analizing of results
- Время загрузки для взаимодействия
Это самая важная характеристика — и самая тяжелая. Отметка времени, когда страница становится полностью готова к взаимодействию с пользователем. Этот момент наступает, когда:
отобразилась страница зарегистрировались обработчики событий для большинства видимых елементов отклик на действия пользователя составляет менее 50 мс
По сути, страница должна прорисоваться, не тормозить и быть готовой реагировать на действия.
- Индекс скорости загрузки
Показывает, насколько быстро контент страницы становится доступен для просмотра. Для оценки используется модуль Speedline.
Это время, когда страница в браузере перестает изменяться визуально. Для определения используется покадровое сравнение вида страницы.
- Время загрузки первого контента
Показатель, который определяет интервал времени между началом загрузки страницы и появлением первого изображения или блока текста.
- Время окончания работы ЦП
Этот параметр показывает время, в которое основной поток страницы становится достаточно свободен для обработки ручного ввода. Этот момент наступает, когда:
большинство элементов на странице уже интерактивны страница реагирует на действия пользователя за разумное время отклик на действия пользователя составляет менее 50 мс
Русский перевод этой метрики немного теряет суть. В оригинале она звучит First CPU Idle — первый простой процессора. Но и это не совсем правда. Подразумевается момент в загрузке страницы, когда она уже в основном может реагировать на действия, хоть и продолжает прогружаться.
- Время загрузки достаточной части контента
Этот параметр показывает время, по истечении которого становится виден основной контент страницы. Этот момент наступает, когда:
случилось наибольшее изменение вида страницы прогрузились шрифты
- Приблизительное время задержки при вводе
Это наименее значимая характеристика. Показывает время в миллисекундах, которое занимает реакция страницы на действия пользователя в течение самых занятых 5 с загрузки страницы. Если это время превышает 50 мс, пользователям может показаться, что ваш сайт притормаживает.
Каждая метрика сравнивается с показателями всех оцененных сайтов. Если у вас она лучше, чем у 98% сайтов, вы получаете 100 баллов. Если лучше, чем у 75% сайтов — вы получаете 50 баллов.