Competent
UML: Structure Diagrams
This type of diagrams try to analyze and depict the structure of a system or process
Diagrams
A good diagram can often help communicate ideas about a design, particularly when you want to avoid a lot of details. Diagrams can also help you understand either a software system or a business process. As part of a team trying to figure out something, diagrams both help understanding and communicate that understanding throughout a team. Although they aren't, at least yet, a replacement for textual programming languages, they are a helpful assistant.
Structural UML Diagrams:
- Class Diagram
- Component Diagram
- Deployment Diagram
- Object Diagram
- Package Diagram
- Profile Diagram
- Composite Structure Diagram
Class Diagram (Advanced)
Keywords
One of the challenges of a graphical language is that you have to remember what the symbols mean. With too many, users find it very difficult to remember what all the symbols mean. So the UML often tries to reduce the number of symbols and use keywords instead. If you find that you need a modeling construct that isn't in the UML but is similar to something that is, use the symbol of the existing UML construct but mark it with a keyword to show that you have something different
Multiple and Dynamic Classification
Classification refers to the relationship between an object and its type. Mainstream programming languages assume that an object belongs to a single class. But there are more options to classification than that. In single classification, an object belongs to a single type, which may inherit from supertypes. In multiple classification, an object may be described by several types that are not necessarily connected by inheritance.
Dynamic classification allows objects to change class within the subtyping structure; static classification does not. With static classification, a separation is made between types and states; dynamic classification combines these notions.
Association Class
Association classes allow you to add attributes, operations, and other features to associations
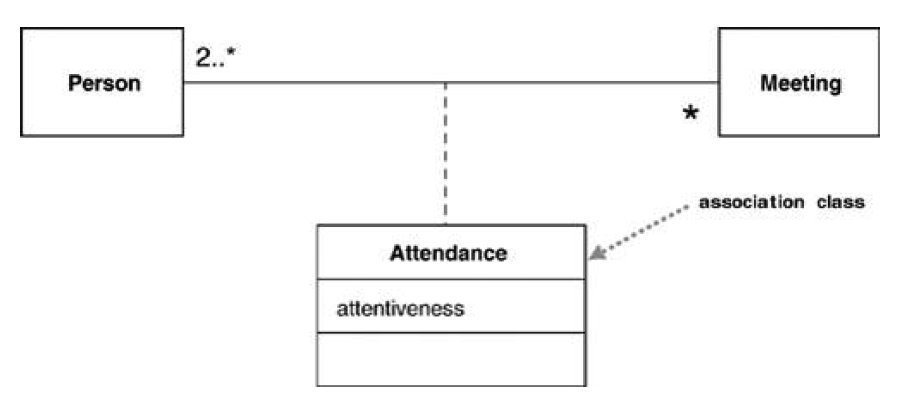
The association class adds an extra constraint, in that there can be only one instance of the association class between any two participating objects.
Template (Parameterized) Class
Several languages, most noticeably C++, have the notion of a parameterized class, or template
class Set <T> {
void insert (T newElement);
void remove (T anElement);
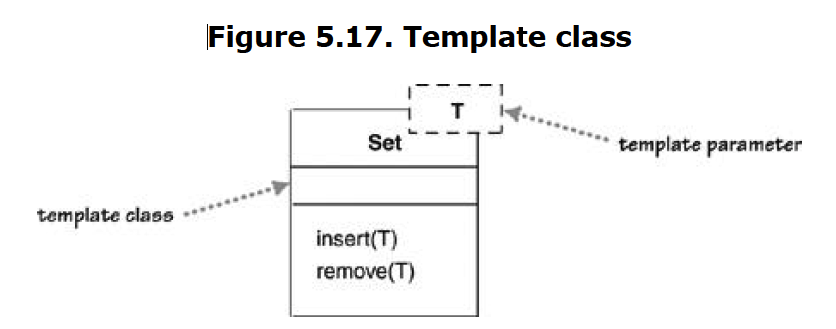
A use of a parameterized class, such as Set<Employee>, is called a derivation.
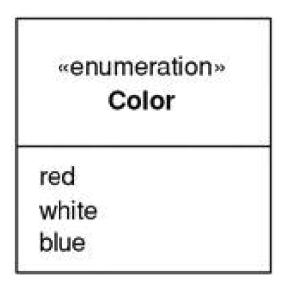
Enumerations
Enumerations are used to show a fixed set of values that don't have any properties other than their symbolic value. They are shown as the class with the «enumeration» keyword.
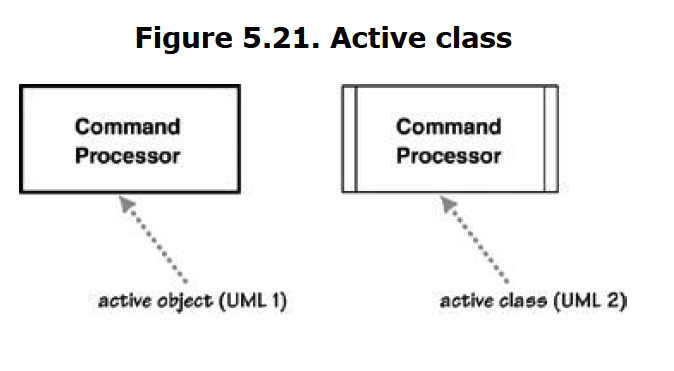
Active Class
An active class has instances, each of which executes and controls its own thread of control. Method invocations may execute in a client's thread or in the active object's thread. A good example of this is a command processor that accepts command objects from the outside and then executes the commands within its own thread of control.
Visibility
Visibility is a subject that is simple in principle but has complex subtleties. The simple idea is that any class has public and private elements. Public elements can be used by any other class; private elements can be used only by the owning class. However, each language makes its own rules.
Although many languages use such terms as public, private, and protected, they mean different things in different languages. These differences are small, but they lead to confusion, especially for those of us who use more than one language.
UML provides four abbreviations for visibility:
+public–private~package#protected
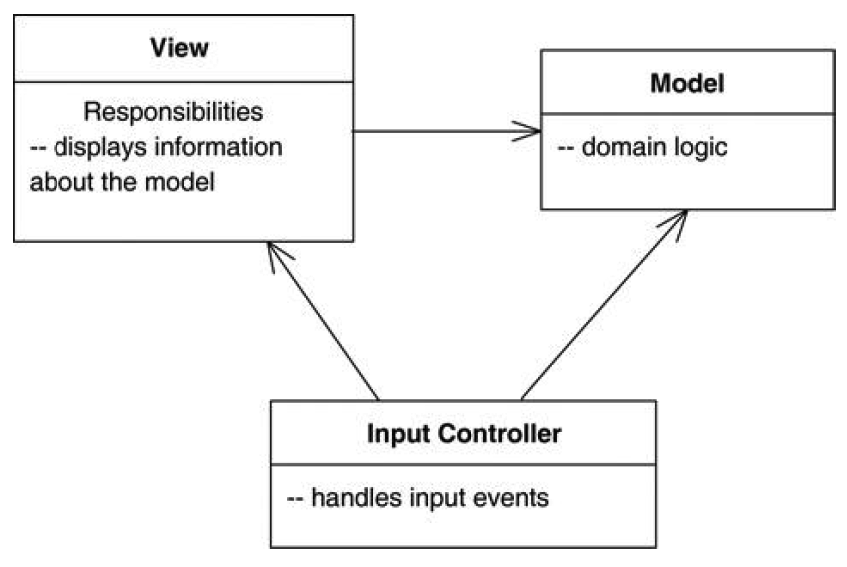
Responsibilities
Often, it's handy to show responsibilities (page 63) on a class in a class diagram. The best way to show them is as comment strings in their own compartment in the class. You can name the compartment, if you wish, but I usually don't, as there's rarely any potential for confusion.
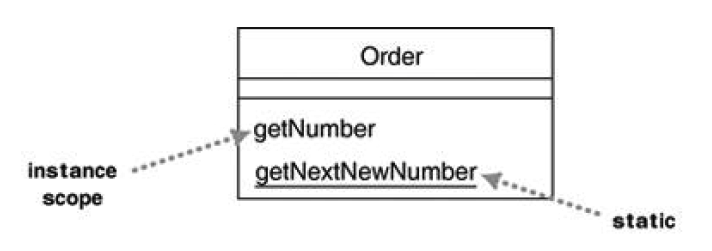
Static Operations and Attributes
The UML refers to an operation or an attribute that applies to a class rather than to an instance as static.
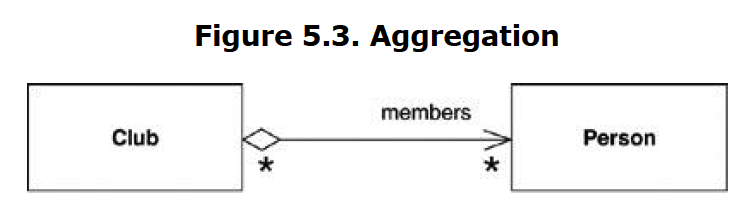
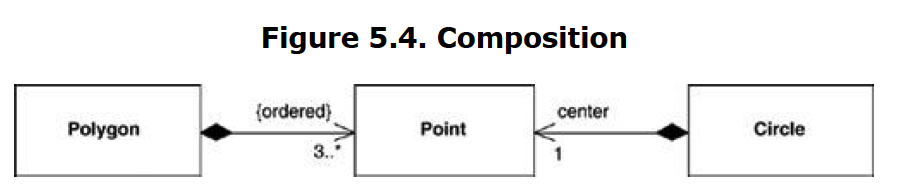
Aggregation and Composition
Derived Properties
Interfaces and Abstract Classes
Component Diagram
When dealing with documentation of complex systems, component UML diagrams can help break down the system into smaller components. Sometimes it is hard to depict the architecture of a system because it might encompass several departments or it might employ different technologies.
A component diagram displays the structural relationship of components of a software system. These are mostly used when working with complex systems with many components. Components communicate with each other using interfaces. The interfaces are linked using connectors. The image below shows a component diagram.
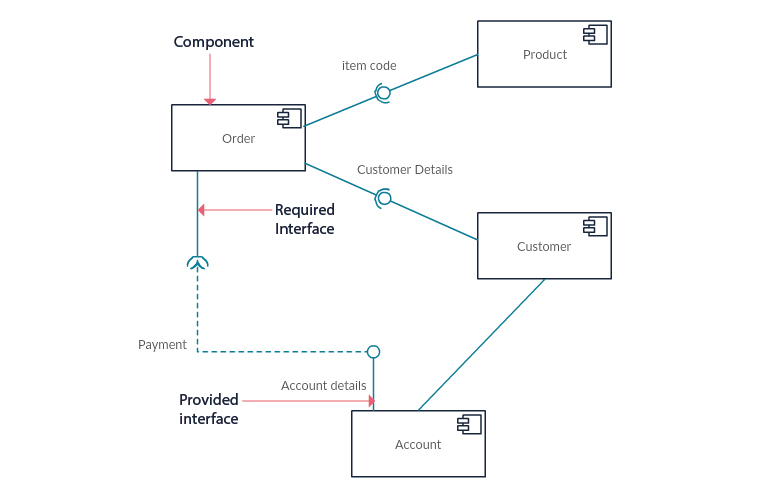
Use component diagrams when you are dividing your system into components and want to show their interrelationships through interfaces or the breakdown of components into a lower-level structure.
Package Diagram
As the name suggests, a package diagram shows the dependencies between different packages in a system.
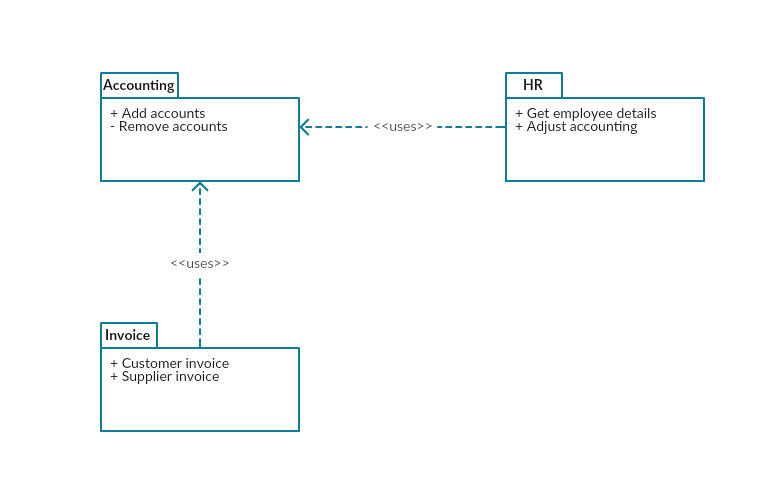
The package diagram is like a macro container for deployment UML diagrams. Different packages contain nodes and artifacts. They organize the model diagrams and components into groups, the same way a namespace encapsulates different names that are somewhat interrelated.
Ultimately a package can also be constructed by several other packages in order to depict more complex systems and behaviors. The main purpose of a package diagram is to show the relations between the different large components that make up a complex system. Programmers find this abstraction opportunity a good advantage for using package diagrams, especially when some details can be left out of the big picture.
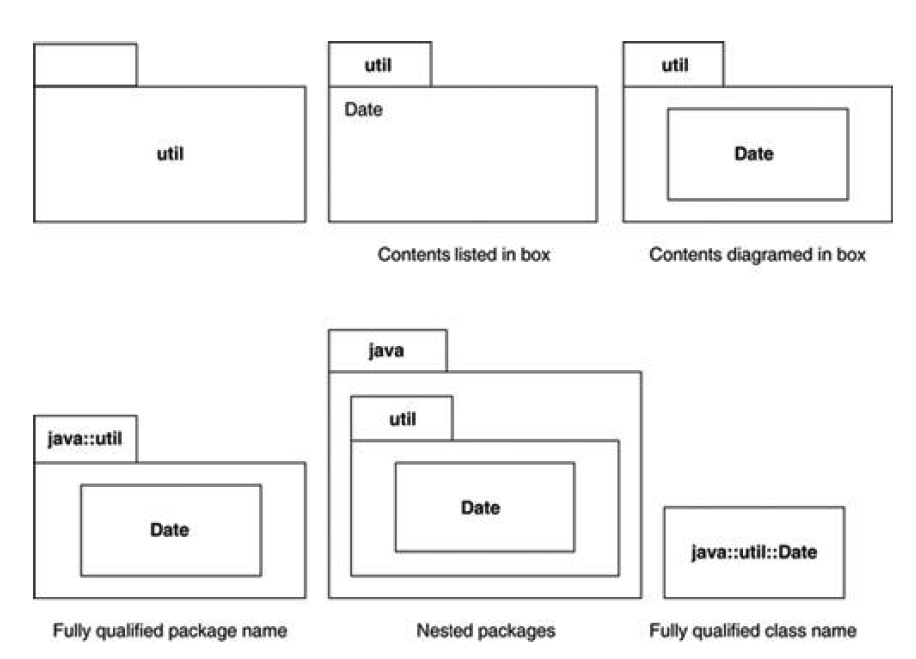
Classes represent the basic form of structuring an object-oriented system. Although they are wonderfully useful, you need something more to structure large systems, which may have hundreds of classes.
A package is a grouping construct that allows you to take any construct in the UML and group its elements together into higher-level units. Its most common use is to group classes, and that's the way I'm describing it here, but remember that you can use packages for every other bit of the UML as well. In a UML model, each class is a member of a single package. Packages can also be members of other packages, so you are left with a hierarchic structure in which top-level packages get broken down into subpackages with their own subpackages and so on until the hierarchy bottoms out in classes. A package can contain both subpackages and classes.
In programming terms, packages correspond to such grouping constructs as packages (in Java) and namespaces (in C++ and .NET).
Deployment Diagram
A deployment diagram shows the hardware of your system and the software in that hardware. Deployment diagrams are useful when your software solution is deployed across multiple machines with each having a unique configuration. Below is an example deployment diagram.
Deployment diagrams are used to visualize the relation between software and hardware. To be more specific, with deployment diagrams we can construct a physical model of how software components (artifacts) are deployed on hardware components, known as nodes.
A typical simplified deployment diagram for a web application would include:
- Nodes (application server and database server)
- Artifacts (application client and database schema
The nodes host the artifacts. The database schema runs on the database server and the application client runs on the application server.
As the name suggests, the deployment diagram shows exactly where each software component is deployed.
UML: Behavior Diagrams
Behavior UML Diagrams describe the behavior of the system, its actors, and its building components.
- Use Case Diagram
- Activity Diagram
- State Machine Diagram
- Sequence Diagram
- Communication Diagram
- Interaction Overview Diagram
- Timing Diagram
Activity Diagram
Activity diagrams represent workflows in a graphical way. They can be used to describe the business workflow or the operational workflow of any component in a system. Sometimes activity diagrams are used as an alternative to State machine diagrams.
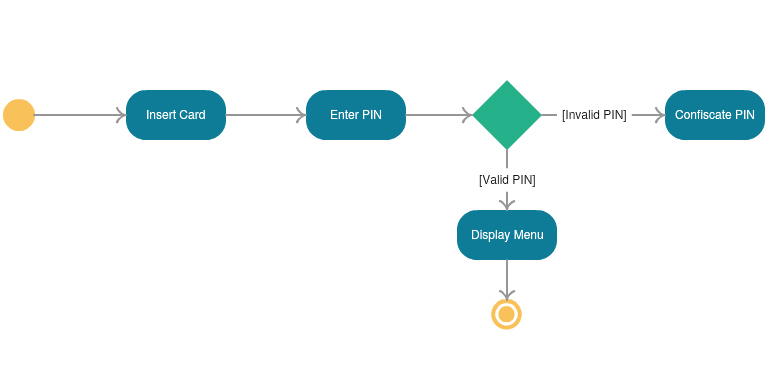
Activity diagrams are probably the most important UML diagrams for doing business process modeling. In software development, it is generally used to describe the flow of different activities and actions. These can be both sequential and in parallel. They describe the objects used, consumed or produced by an activity and the relationship between the different activities. All the above are essential in business process modeling.
Activity diagrams are a technique to describe procedural logic, business process, and work flow. In many ways, they play a role similar to flowcharts, but the principal difference between them and flowchart notation is that they support parallel behavior.
The activity diagram allows whoever is doing the process to choose the order in which to do things. In other words, the diagram merely states the essential sequencing rules I have to follow. This is important for business modeling because processes often occur in parallel. It's also useful for concurrent algorithms, in which independent threads can do things in parallel.
Use Case Diagram (Advanced)
Use cases are a technique for capturing the functional requirements of a system. Use cases work by describing the typical interactions between the users of a system and the system itself, providing a narrative of how a system is used.
Rather than describe use cases head-on, I find it easier to sneak up on them from behind and start by describing scenarios. A scenario is a sequence of steps describing an interaction between a user and a system. So if we have a Web-based on-line store, we might have a Buy a Product scenario that would say this:
The customer browses the catalog and adds desired items to the shopping basket.
When the customer wishes to pay, the customer describes the shipping and credit
card information and confirms the sale. The system checks the authorization on the
credit card and confirms the sale both immediately and with a follow-up e-mail.
This scenario is one thing that can happen. However, the credit card authorization might fail, and this would be a separate scenario. In another case, you may have a regular customer for whom you don't need to capture the shipping and credit card information, and this is a third scenario.
All these scenarios are different yet similar. The essence of their similarity is that in all these three scenarios, the user has the same goal: to buy a product. The user doesn't always succeed, but the goal remains. This user goal is the key to use cases: A use case is a set of scenarios tied together by a common user goal.
In use case–speak, the users are referred to as actors. An actor is a role that a user plays with respect to the system. Actors might include customer, customer service rep, sales manager, and product analyst. Actors carry out use cases. A single actor may perform many use cases; conversely, a use case may have several actors performing it. Usually, you have many customers, so many people can be the customer actor. Also, one person may act as more than one actor, such as a sales manager who does customer service rep tasks. An actor doesn't have to be human. If the system performs a service for another computer system, that other system is an actor.
Actor isn't really the right term; role would be much better. Apparently, there was a mistranslation from Swedish, and actor is the term the use case community uses.
Levels of Use Cases
A common problem with use cases is that by focusing on the interaction between a user and the system, you can neglect situations in which a change to a business process may be the best way to deal with the problem. Often, you hear people talk about system use cases and business use cases.
The terms are not precise, but in general, a system use case is an interaction with the software, whereas a business use case discusses how a business responds to a customer or an event. [Cockburn, use cases] suggests a scheme of levels of use cases. The core use cases are at "sea level." Sea-level use cases typically represent a discrete interaction between a primary actor and the system. Such use cases will deliver something of value to the primary actor and usually take from a couple of minutes to half an hour for the primary actor to complete. Use cases that are there only because they are included by sea-level use cases are fish level. Higher, kite-level use cases show how the sea-level use cases fit into wider business interactions. Kite-level use cases are usually business use cases, whereas sea and fish levels are system use cases.
State Diagram
State machine diagrams are similar to activity diagrams, although notations and usage change a bit. They are sometimes known as state diagrams or state chart diagrams as well. These are very useful to describe the behavior of objects that act differently according to the state they are in at the moment. The State machine diagram below shows the basic states and actions.
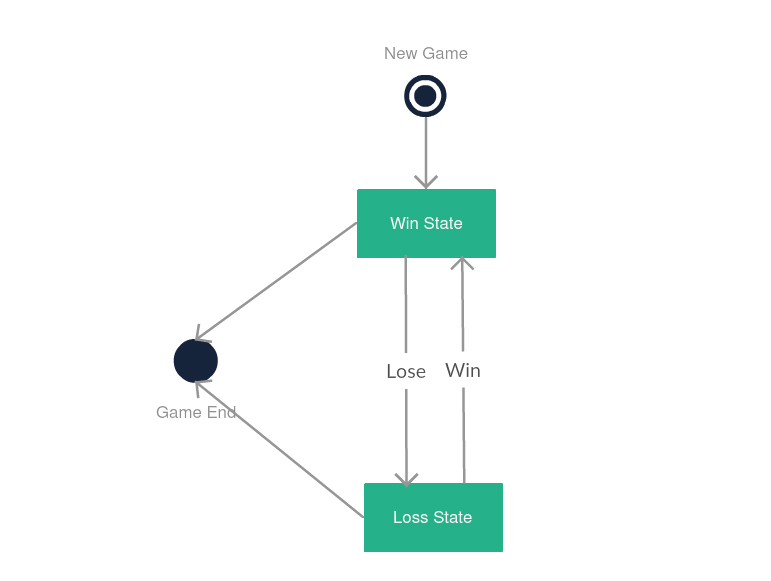
State machine UML diagrams, also referred to as Statechart diagrams, are used to describe the different states of a component within a system. It takes the name state machine because the diagram is essentially a machine that describes the several states of an object and how it changes based on internal and external events.
A very simple state machine diagram would be that of a chess game. A typical chess game consists of moves made by White and moves made by Black. White gets to have the first move and thus initiates the game. The conclusion of the game can occur regardless of whether it is the White’s turn or the Black’s. The game can end with a checkmate, resignation or in a draw (different states of the machine).
UML: Interaction Diagrams
Interaction Overview UML diagrams are probably some of the most complex ones. So far we have explained what an activity diagram is. Additionally, within the set of behavioral diagrams, we have a subset made of four diagrams, called Interaction Diagrams:
- Interaction Overview Diagram
- Timing Diagram
- Sequence Diagram
- Communication Diagram
So, the interaction overview diagram is an activity diagram made of different interaction diagrams. Let’s say that it is a mix of activity diagrams with interaction diagrams, however, most websites like to regard them as specialized activity diagrams. What this means is that you can use most annotations that are used within an activity diagram, with the addition of elements such as interaction, interaction use, time constraint, duration etc…
Timing Diagram
Timing diagrams are very similar to sequence diagrams. They represent the behavior of objects in a given time frame. If it’s only one object, the diagram is straightforward. But, if there is more than one object is involved, a Timing diagram is used to show interactions between objects during that time frame
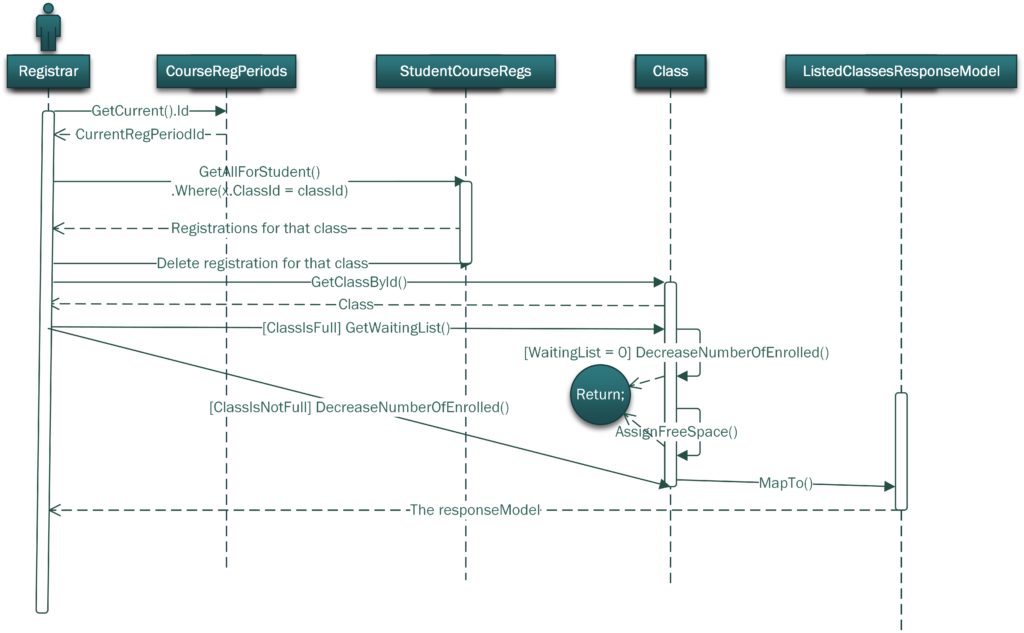
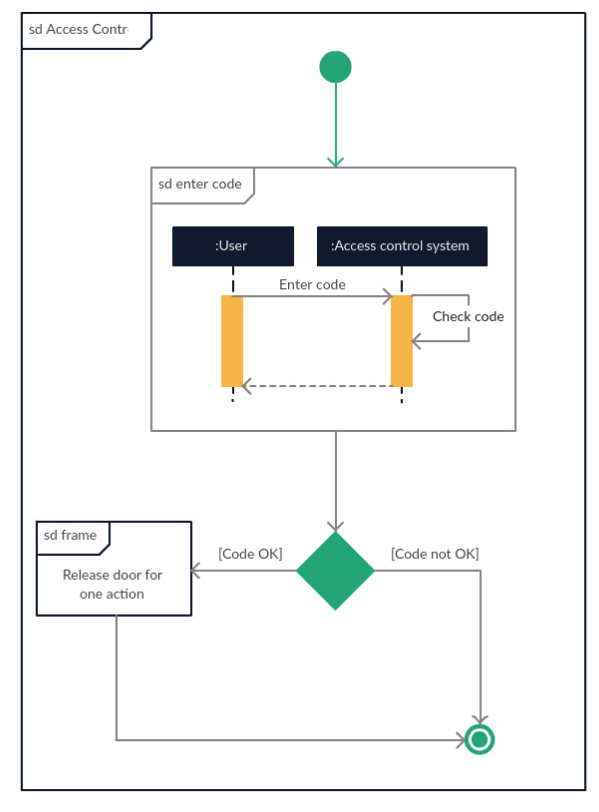
Sequence Diagram
Sequence diagrams are probably the most important UML diagrams among not only the computer science community but also as design-level models for business application development. Lately, they have become popular in depicting business processes, because of their visually self-explanatory nature.
As the name suggests, sequence diagrams describe the sequence of messages and interactions that happen between actors and objects. Actors or objects can be active only when needed or when another object wants to communicate with them. All communication is represented in a chronological manner. To get a better idea, check the example of a UML sequence diagram below.
As the name suggests, structural diagrams are used to depict the structure of a system. More specifically, it is used in software development to represent the architecture of the system and how the different components are interconnected (not how they behave or communicate, simply where they stand).
Below you can see an example of a sequence diagram, depicting a course registration system.