Expert
Engineering Process Planning
Deployment process
These three focal points have a few things in common:
- They take less then 90 minutes to try out
- They build on leading practices from the worlds of innovation and design (why reinvent the wheel?)
- They pair readily with a modern practice of agile
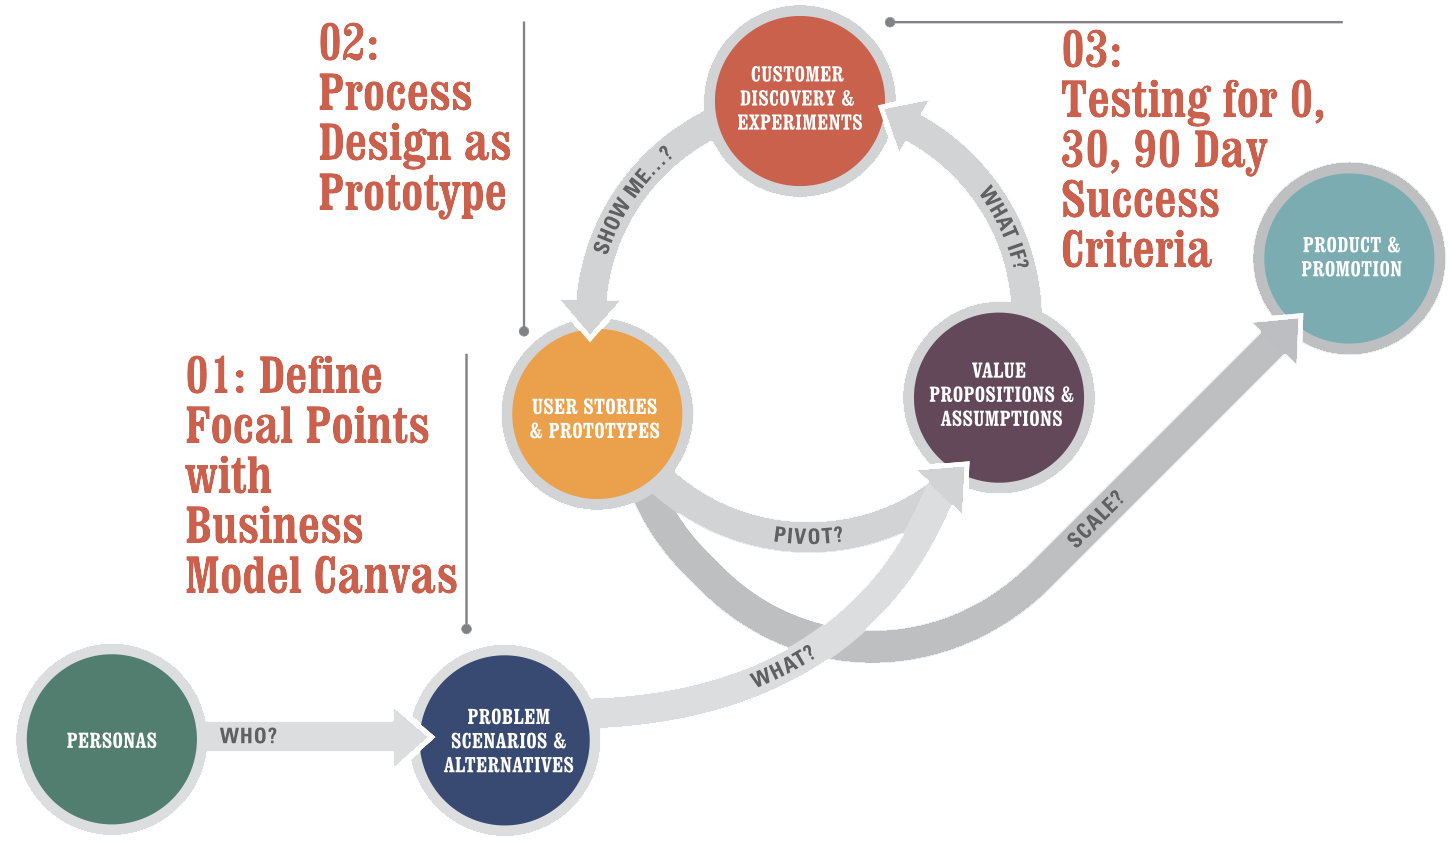
Define Focal Points with the Business Model Canvas
The basic idea here is to describe a strategy that
a) has buy-in from your stakeholders and is consistent with the corporate strategy while b) being consumable and actionable by IT teams. For this, we’ll be using the Business Model Canvas. It is a one-page business model design tool that’s great for getting to the point and driving action. It’s also fast and will help you avoid getting bogged down in an overly elaborate strategy project.
For (target customer) who (statement of the need or opportunity), the (product name) is a (product category) that (statement of key benefit – that is, compelling reason to buy). Unlike (primary competitive alternative), our product (statement of primary differentiation).
- Who are the buyers, users and why do they buy?
- What is the end-to-end customer experience?
- What activities are strategically important?
- How does this matter for enterprise software again?
Process Design as Prototype
Deliverable: Individual Atomic Processes & User Stories for Detail
An atomic process always has
- A discrete input (see circle on the far left)
- A series of transformative steps (see the rectangles, triangles and flows)
- A discrete output (see the circle on the far right)
- These three metrics: process, output, outcome (more on that shortly)
Designing User Experience with Stories
“As a [persona],
I want to [do something],
so that I can [derive a benefit/realize a reward]”
Testing for 0, 30, 90 Day Success Criteria
Remember that rant earlier about how outcomes are more important than output (even though output shows better in the short term)? Well, this is how to consistently manage outcomes in a relatively simple way. 0 Day success criteria has to do with usability testing. 30 day success criteria has to do with testing for user engagement and ongoing consistency with your earlier results on usability. 90 day success criterial has to do with whether what you’ve done is driving the underlying outcome it was supposed to achieve (less overhead, more throughput, lower errors
Deliverable: Test Designs & Decision Criteria
- Start by Proposing Problems
- Propose a Testable Solutions
- Example Validation Criteria
- The Importance of Working in Small Batches with Accountable Reporting
- Managing Outcome-Driven Projects
Microsoft Security Development Lifecycle
SDL – Security Development Lifecycle – методика разработки безопасных программ, применяемая на Microsoft
SDL обычно представляется как дополнение-модификация классической модели «водопада» – «waterfall». Тем не менее, приложив ум, ее достаточно легко модифицировать и для практически любой другой модели, включая Scrum или WhiteWater.
- Фаза требований
- Фаза дизайна
- Фаза реализации
- Фаза верификации
- Фаза выпуска
- Фаза поддержки
Фаза требований – requirements
Классической первой фазой модели «водопада» является фаза определения требований к продукту и планировния. В рамках SDL вы определяете дополнительные требования к продукту, которые должны гарантировать его безопасность.
Примеры таких требований:
Каждый член команды должен пройти какой-нибудь курс по безопасности ПО в последний год. Кстати, это реальное требование к выпуску продуктов в Microsoft.
- Весь код должен проходить проверку автоматическими средствами анализа кода после фильтров правил установленных менеджментом.
- Тест должен провести проверку на поведение системы со случайным вводом ("fuzzing").
- Продукт должен пройти тестирование на предмет атак ("penetration testing").
- Продукт должен пройти ревью отдельной командой (внешней или другой командой фирмы, не связанной с командой, производящей продукт)
Фаза дизайна
Это фаза, когда вы определяете архитектуру безопасности вашего продукта, принципы, которым вы должны следовать (изоляция компонент, «слойная» структура, минимальные права, и т.д.) Не все из этого можно использовать в любом проекте, но наличие такого решения заранее помогает потом аргументировать правильные решения, когда очень хочется «срезать угол».
Фаза дизайна, а точнее ее самый конец – это также время для так называемого моделирования угроз ("threat modeling"). Официально SDL требует ее на фазе дизайна, что вызывает естественную критику – как мы можем моделировать угрозы тому, что мы еще даже не придумали? Однако, когда вы это все-таки придумали, полезно подумать также и о том, как это могут сломать. В идеале, об этом следует думать именно тогда, когда вы придумываете, что собираетесь делать, но практически это обычно не выходит. Поэтому очень полезно сделать это хотя бы сразу после и до того как написана первая строчка кода.
Фаза реализации
Наиболее важные элементы в фазе реализации связаны с проверкой создаваемого кода различными способами. Эти способы включают в себя:
Стандарты кодирования и тестирования. Например, запрет на использование strcpy() и использование ее безопасного эквивалента взамен, или аннотация всех API используя SAL, который помогает автоматической верификации кода. Использование средств анализа кода, например, FxCop, который вы можете загрузить бесплатно с MSDN. Да, часто такие средства поднимают панику и по-прежнему у них очень много ложных сигналов, но когда вы привыкнете их использовать, вы обнаружите, что они действительно находят и реальные проблемы в коде, вроде разыменований NULL указателя. Использование специальных средств тестирования, в особенности «fuzzing» средств, который скармливают случайные данные в ваши API и сетевые каналы. Поначалу кажется, что они не способны дать ничего интересного, но я лично видел как грамотно использованные fuzzing tools выявили вполне резонные и серьезные баги, которые благодаря этому удалось исправить до выпуска продукта. И, наконец, инспекции кода (code reviews)! Да-да, любая нормальная команда и так это должна делать, но SDL об этом говорит специально.
Фаза верификации
На этой фазе производится так называемый «security push». Он включает в себя бета-тестирование, полезное не только ради безопасности, специальные инспеции кода на безопасность, специальные виды тестирования вроде penetration testing (тестирование на потенциальные атаки) и расширенное fuzz testing (тестирование на плохо сформированные данные).
Говоря об инспекциях кода, повторюсь, любая нормальная команда должна делать их перед тем как отправлять его в систему контроля версий, но тут речь идет о несколько другом виде инспекций кода. Я говорю, об инспекции кода спецально для выявления проблем с безопасностью – в первую очередь потенциальные переполнения буферов (уже упомянутые С строки и адресная арифметика), использование неочищенного пользовательского ввода (в SQL, в запросах в WMI, в именах файлов...), передача прав туда, где они излишни, просто способность внешнего пользователя завесить или сломать систему (например, сможет ваш социальный сайт загрузить фото в 5 гигабайт и преобразовать его во внутренний формат?)
Фаза выпуска
Фаза выпуска описана в SDL в основном через деятельность в ходе FSR – Final Security Review. Это процесс в котором отдельностоящая команда проверяет выполнили ли вы требования по безопасности, обязательные для всех продуктов, выпускаемых фирмой, равно как и ваши собственные требования по безопасности, установленные в фазе требований.
Фаза поддержки
Вы думали с выпуском все закончено? Отнюдь. Что произойдет, если в вашем продукте обнаружится критический баг?
К этому надо быть готовым. «Быть готовым» означает иметь список людей и их телефонов, которых, если понадобится, придется разбудить среди ночи. Это означает план, что делать. Это означает план как доставить пользователям исправленный вариант. В общем, мало выпустить продукт – надо быть готовым его сопровождать.
Немаловажным элементом реакции на проблемы также является способность научиться на ошибках и добавить то, чему научились, в процесс или те же самые инструменты анализа кода, чтобы такое более не повторялось.
Модель угроз – Threat Modeling
«Угроза» – это не то, что злоумышленник может. Если он может, то вы прошляпили баг. Угроза – это то, что злоумышленник хочет. Даже если и не может.
«Модель угроз» делается по принципу, который я называю 3A – Assets, Actors, Actions. Активы, Актеры, Действия.
Активы – это то, что вы защищаете, то, доступ к чему должен быть закрыт или ограничен. Это файловые системы используемых в системе машин, регистрационные файлы, сервисы, ресурсы, и наконец, собственно сервис вашего продукта, который тоже может быть структуирован – одно дело данные базы данных, другое дело – ее настройка.
Актеры – это те, кто могут иметь доступ к системе. Администраторы, пользователи, гости-анонимные пользователи... Опять же, в зависимости от вашего продукта, у вас может быть значительно больше категорий. Например, оператор бекапов, оператор ввода форм...
Действия – это то, что актер может (или хочет) сделать с активом. Создать. Прочитать. Изменить. Удалить. Использовать. Не все действия применимы ко всем активам, но те, что возможны, нужно учесть.
Evaluating Application Performance
Users will complain if your application performs slowly. Yet, in most scenarios, application performance is an afterthought at the beginning of development; therefore, consider application performance testing in the initial stages of the application development life cycle. Those test results can be used to improve application design, determine application health, and document minimum and recommended business requirements that the application needs to fulfill. The three categories of application performance that are generally measured and monitored are application response time, throughput, and resource use (CPU, memory, and so on).
Performance Modeling
The first step to take when considering the performance of an application is to create a model of the anticipated performance metrics of the application and validate that model. Performance modeling is the process of prototyping an application to determine what resources your application will require to perform well and continue performing well. Performance modeling allows you to incorporate performance concerns into the application design to ensure that the end result will comply with performance requirements.
The performance model should be created in the design phase of the application life cycle. Performance modeling is an iterative process, and the model should be continually updated throughout the development cycle. The performance model should document and incorporate any known business requirements as well as any other design models that might affect performance, such as the security model. The performance model should also identify target deployment environments and can be created by using the tool of choice. However, Microsoft Office Word is typically used to create models.
A performance model validates the design of an application, and you can use it to identify flaws early in the development life cycle. You can create a performance model through a standard eight-step process, as listed here.
- Identify key usage scenarios that represent target deployment execution environments for the application.
- Identify the user and transaction workloads that an application must support.
- Identify performance objectives and business requirements for the application. Performance objectives include anticipated application response time, application throughput, and resource use. For instance, a business requirement might be that an application must consume particular Web services.
- Identify application budget constraints. These include both financial budget constraints and physical resource constraints.
- Identify processing steps. The processing steps implemented by an application must be broken down and individually optimized to improve performance. Processing steps are typically represented like a use case or sequence diagram.
- Allocate budget. This step assigns portions of the operating budget to individual processing steps.
- Evaluate your model. Evaluate the assignment of the operating budget to processing steps to ensure that it complies with performance objectives and business requirements.
- Validate your model. Once a performance model is in place, it must be evaluated through testing. Thoroughly test a performance model under varying conditions, using multiple platforms, resources, and loads.
The primary output of a performance model is a performance baseline, or benchmark, that is used to predict how an application will perform with given resources and loads. A performance baseline is required to determine whether an application is performing well or poorly in a scenario, while the application is being tested, and when it is deployed to production. A recorded performance baseline can take the form of recorded performance metrics associated with a given application execution environment (operating system, software resources, hardware resources, network resources, and so on).
Identifying Application Performance Spikes
A performance spike is a noticeable and dramatic increase in the use of processor time, memory resources, disk activity, or similar resource usage by an application. How do you determine whether an application is using more resources than normal? You identify an increase in resource usage by comparing application resource usage to the performance baseline created for the application.
When comparing application performance data to a performance baseline, there are several things to be aware of. For example, applications typically use more resources while the application is starting up; this is common behavior for all applications. Although the time required to start an application is normally miniscule compared to the time during which the application runs, application resource usage data might more accurately represent run-time resource usage and identify performance spikes if application startup resource usage values are eliminated from overall usage data.
One of the primary things you try to avoid by analyzing application performance data is memory paging. As each application (process) is loaded, the operating system assigns a portion of the available memory to the application. The amount of memory assigned to the application is called the application’s working memory set. In 32-bit versions of Microsoft Windows, a working set can be up to 4 gigabytes (GB) in size. However, because most systems don’t have 4 GB of memory available, the working sets for most applications are much smaller and, furthermore, an application might not be actively using all of the memory assigned to its memory working set. As more applications are started, the operating system might begin to run out of memory to assign to applications. If this occurs, Windows will borrow memory from the working sets of less-active applications. When the operating system can no longer borrow memory from applications, it will begin to page, or persist, the contents stored in memory to the hard disk. Reading from and writing to a hard disk is significantly slower than reading from and writing to memory. Hence, the performance of all applications will suffer dramatically if paging occurs.
Note that if anything in the execution environment of an application changes permanently, the performance baseline should be updated to reflect the impact of the change. Any change could affect application performance. For instance, if the number of users increases, a greater load will be placed on the application. Conversely, if the amount of memory available on the server hosting an application is increased, the server will have more memory available to assign to application memory working sets, paging is less likely to occur, and, as a rule of thumb, the overall performance of all applications hosted on the server will increase.
To be able to identify a performance spike, you must first define an acceptable variance from the performance baseline. An application will not use a consistent quantity of any single resource or combination of resources but will fluctuate resource usage based on several factors, including available resources and application loads. There is no generic rule that is used to identify performance spikes. You must determine for your application and execution environment what performance metrics fall outside of an acceptable variance from the performance baseline. For example, you could determine that if your application uses more than 256 MB of memory, it is operating beyond expected limits.
Once acceptable application performance variances have been defined, you can use Performance Monitor to define and configure alarms to perform actions if application performance ventures beyond your variances.
Monitoring Tools
The most straightforward method of monitoring application performance metrics is to use a tool external to the application that is designed for this purpose. Microsoft offers several performance monitoring tools, and many third-party monitoring tools are available on the market.
Windows Performance Monitor Windows Performance Monitor is included with Microsoft Windows NT, Windows 2000, Windows XP, Microsoft Windows Server 2003, and Windows Vista. Because Windows Performance Monitor is easily accessible and free to use, it is the most commonly used performance monitoring tool. It can be used to monitor multiple performance metrics for multiple applications simultaneously, and it can be used to monitor performance metrics of the operating system and services.
Each performance metric that is monitored using Performance Monitor is referred to as a counter, and Performance Monitor maintains a collection of counters that are registered and available for monitoring. Performance metric counters are inactive until they are added to the list of counters actively being monitored. Several counters are automatically registered in Performance Monitor by the operating system, and most services and server-level applications that are installed register additional counters associated with the application or service being installed. Depending on the software installed and the machine configuration, there can be hundreds of counters registered in Performance Monitor. The counters that you need to monitor in a given scenario depend on the scenario at hand. The counters monitored by default in Performance Monitor are \Memory\Pages/sec, \PhysicalDisk(_Total)\Avg. Disk Queue Length, and \Processor(_Total)% Processor Time.
Performance Monitor also maintains logs of counters that are actively being monitored, and alerts can be configured to trigger an action based on the status of a performance metric. Performance Monitor is located in Administrative Tools in Control Panel and might be listed as Performance Monitor or simply Performance.
Profiling Tools
Monitoring tools are designed to render generally high-level views of the performance of an operating system, application, service, or component. Profiling tools are tightly coupled to their source and are designed to render very low-level, specific results. Conversely, because they are tightly coupled, profiling tools are considered to be intrusive because they significantly degrade the performance of the applications being profiled. Application profiling should be performed at length in a test environment only and not in a production environment. Applications are generally profiled in a production environment only if a production security concern must be traced or a production environment bug must be reproduced. Two commonly used profiling tools are CLR Profiler and SQL Server Profiler.
CLR Profiler CLR Profiler is designed to profile common language runtime (CLR)-managed applications created by using the .NET Framework. The CLR manages .NET applications, and the primary point of concern and area for improvement is memory use. As such, CLR Profiler is used principally to analyze how the application uses memory in the managed heap. CLR Profiler is capable of profiling executable applications, ASP.NET Web applications, and Windows Services applications and is capable of saving the profiler results and passing parameters to applications.
SQL Server Profiler SQL Server Profiler is similar to CLR Profiler; however, it is designed to profile SQL Server databases. SQL Server Profiler was originally released with SQL Server 7.0 and has been available a little longer than CLR Profiler. Each profile monitored by SQL Server Profiler is referred to as a trace. A trace can be configured to capture virtually any level of detail and any event initiated by a SQL Server database application, including queries, locks, and transactions. In fact, if a trace is not configured to ignore activity carried out in SQL Server Profiler, you will notice that the actions you are carrying out in the profiler are added to the log as soon as you begin monitoring metrics using the trace.
What Is a Deployment Plan?
Application design and development is a complex process, so all aspects of development should be thoroughly planned. An application deployment plan should be created in the same manner that a performance plan and a security plan are created. An application deployment plan should be created in the design phase of the application development cycle. However, the deployment plan, as with most of the application development plans, should remain in flux because it will, undoubtedly, need to be modified and updated as the application is developed and tested.
A deployment plan is a single sub-plan of the larger collective project plan. The deployment plan should:
- Briefly restate the purpose of the application. The application should be described in detail in the primary project plan document.
- Determine all proposed target execution environments.
- List all resource requirements, both minimum and recommended, for all target execution environments. This list should also determine if the .NET Framework must be redistributed with the deployed solution.
- List any configuration requirements that must be made to the target execution environment when the solution is deployed.
- Outline expected deployment scenarios, possible issues, and how to resolve them ahead of time based on testing. Every step of a deployment plan should be tested thoroughly to ensure success.
- Identify who will complete the deployment. Will the application be installed on a server or at the client? Will the application be downloaded and installed by users, purchased and installed by users, deployed across an enterprise, or installed by internal staff?
- Integrate information contained in the security plan, the performance plan, the disaster recovery plan, and any other plans to ensure that the target execution environment is configured correctly.
- Identify any preexisting applications with which the deployed solution must integrate and the specifics of how this will occur.
Summary
The three most common performance objectives are response time, throughput, and resource use.
A performance model should be created in the design phase of the application development life cycle. A performance model is used to ensure that the resulting application meets business performance requirements. The output of a performance model is a performance baseline. Using a performance baseline, you can determine whether an application is performing well or poorly in a given execution environment.
Application performance monitoring is the practice of using loosely coupled tools external to the application to track high-level statistical information about the performance metrics of an application. The most commonly used monitoring tool is Windows Performance Monitor.
Application performance profiling is the practice of using tools tightly coupled with an application to track low-level information about the performance metrics of an application.
Instrumentation is the practice of using code integrated into an application to track userdefined information about the performance of an application. The .NET Framework System.Diagnostics namespace includes the Trace and Debug classes for instrumentation.
Application security must be considered in the design phase of the application development cycle even before performance. A formal security plan should be created for each application. Application security monitoring practices include auditing and analyzing event logs.
An application deployment plan should be created in the design phase of the application development cycle. An application deployment plan describes the details of deploying an application to target execution environments.
Visual Studio 2005 includes functionality for creating setup and deployment projects and offers six editors to customize various aspects of the deployment process. You can use scripts to extend and customize the behavior of a setup and deployment project, or you can manually deploy an application or component.
Applications commonly depend on external components to supply additional functionality.
The UML was created as an industry standard method of modeling, diagramming, designing, and describing software development processes. An application flow-logic diagram depicts the components that comprise an application and how they relate.
Cyclomatic complexity is used to measure the complexity of an application by using the number of independent lines and paths between elements and components that comprise an application
Planning for testing
- Unit
- Integration
- Performance
- Stress
Test Case A test case is a piece of code that exercises a particular feature of a specific class. The exercising could consist of checking whether a feature works, but it also includes ensuring that the feature fails in the expected way under the right circumstances.
Test Suite Although test cases form the lowest level of granularity for unit testing, multiple test cases can be grouped together into a test suite. The main purpose of a test suite is to provide a logical unit of execution for the test. That is to say that you would most likely run all of the test cases in a test suite together to determine the success or failure of a code change.
Unit testing
The Properties of a Good Unit Test
To properly evaluate a unit test, as well as to determine what should be tested and how, it is worthwhile to look at what makes a good unit test. Specifically, a unit test should be CIVIL.
- Clear
A good unit test is clear about the intention of the test. Given the propensity for developers not to document the code, a well-designed test suite provides samples of how to invoke the methods in a class as well as of what kinds of errors are expected and when. In other words, unit tests can easily become an important piece of the developer-level documentation for a class. Of course, unit tests are useful as documentation only if another developer can look at the code and understand the goal and technique. For this reason, treat unit test code with the same level of care you give to production code. Ensure that it’s clear, clean, and of clear intention.
- Independent
Design unit tests to be as independent of other parts of the application as possible. This includes abstracting out calls to other classes within the application file. This might be done by using a factory pattern to create instances of certain classes. It might seem inefficient and cause more complicated programming, but there is a benefit to this approach in terms of writing testable code. Unit tests are supposed to exercise a single piece of functionality. Then, if a bug is found, pinpointing the cause is much easier. Maintaining independence of classes enables you to test a class without worrying about whether the subordinate class has been implemented or even whether it is correct.
- Very Fast
A unit test should run as quickly as possible. Although there are times when a particular test might need to run longer than a second, this should absolutely be the exception because the longer it takes for a particular test to run, the less often it will be executed. Developers don’t like to twiddle their thumbs while waiting for a test suite to complete. They have more important things, such as adding new bugs … er … functionality to attend to. Although the ideal (zero-length unit tests) isn’t possible, by aiming for speed, you can help create tests that will be run more frequently.
- Isolated
It should be possible to load and run the unit tests on any system. This means that access to external resources needs to be abstracted out of the system and is performed by isolating the external resource access into a separate class. Then the generation of class instances needs to be implemented through a factory pattern.
By not allowing the unit tests to be dependent on external resources, you help simplify the deployment process. Although it might seem silly to spend time keeping unit tests isolated from external resources, you would not want to spend the first 24 hours installing all the bits and pieces of software required to allow your tests to pass again after you acquire a new computer. Also, if unit tests are dependent on the presence or absence of external resources, it becomes more challenging to run the tests in other environments. Because a well-designed build integration process includes the execution of unit tests, and the build server is not normally a development server, this is a source of potential trouble.
Finally, if you have any experience writing unit tests, you know that one of the most difficult areas to deal with is simulating the failure of an external resource. If you have no experience with this, try to imagine how you would test a disk-full situation without completely filling up a hard drive. It becomes easier to test extreme scenarios by abstracting external resource functionality into another class.
- Limited in Scope
A unit test should concentrate on testing a single entity, partly to conform to the rule about speed stated earlier. More important is the ease in identifying the source of any detected problems. If the test that invokes a single method fails, you have a very good idea where to start your search for a cause.
Integration Testing
Depending on the size of a development team, the writers of the unit tests might be involved in performing other higher-level testing. For the purposes of this chapter, assume that developers are not directly responsible for performing the system-level tests but might be called on to review the testing plan for completeness and appropriateness. In this lesson, you will look at integration testing, stress testing, and performance testing as they relate to evaluation rather than to execution.
Placing integration testing after unit testing is very important. The goal of unit testing is to ensure that the individual methods are working as expected. If any of the unit tests failed or were incomplete and have not been corrected, it will invariably show up in the integration testing. Otherwise, many hours could be spent poring over the integration boundary of the components involved when the real problem is within a particular class, not at the boundary. The design of integration tests for an application resembles the design of unit testing. Both a unit test and an integration test operate on the functionality exposed by a component. The difference is in the definition of a component. For a unit test, a component is a class. For an integration test, a component is a collection of classes that function together to provide larger business functionality. Integration testing is also an iterative process. The test design starts by testing the interface between two components. Then a third component is added, and a different set of tests is defined to test the integration of the three components in unison. The process of aggregating components continues until all the components are in play and functioning together. A number of different approaches to integration testing are available. Each is valid, and the correct choice depends on the skills and tendencies of the people involved.
Performance Testing
The goal of performance testing is to ensure that an application responds properly to a particular set of conditions. The definition of a proper response relates to elements of speed, typically transactions per second; maximum response time; and average response time. Along with ensuring that the application meets whatever performance criteria have been defined for it, performance testing is also aimed at identifying the bottlenecks in the process with the aim of correction.
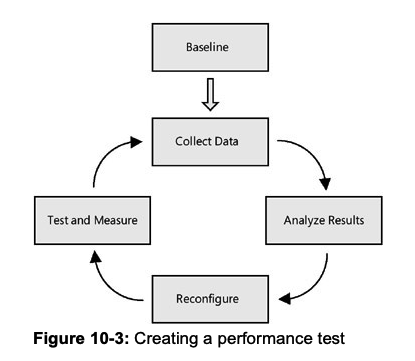
Baseline
The first and most critical step in performance testing is establishing a baseline. This is done by defining a set of performance objectives, test cases, and metrics that are to be measured. Of these three, the most important are the objectives. A successful performance test needs to have a goal. When tuning an application’s performance, it is too tempting to keep fiddling with the configuration settings, trying to squeeze another transaction per second from the application. A performance objective gives you a finish line past which further tuning is not necessary.
Collect Data
This phase of performance testing involves running the test cases and collecting the metrics. Naturally, the specific metrics will vary based on the component being tested. Some of the more common ones include:
- Processor activity (% Processor time, context switches per second, processor queue length)
- Memory (Available memory, pages per second)
- Process (Page faults per second)
- Network card activity (Bytes sent/received per second, discarded packets per second)
Analyze Results
Once the data has been collected, the magic happens. Unfortunately, as in reality, there really isn’t any magic. The analysis involves looking at a set of results and identifying the problem. “Identifying the problem” is a deceptively simple statement. There isn’t any systemic way to identify areas to improve. The correct answer is terribly dependent on the application, the infrastructure, and the interactions between the components. As a practitioner of performance tuning, I would suggest that, in the absence of obvious causes, you invoke what is called the smell test.
The smell test involves trying to identify those parts of the code where the results are significantly different from the expectations. It could be a query that runs more slowly than expected, a Web page that takes too long to load, or a method that is invoked many more times than expected. These are usually good starting points for the analysis. Note in the smell test that although the name implies an ad hoc approach to identifying candidates, that is not true. In each of the cases, the trigger should be some measurable data. You can’t reliably improve the performance of an application that doesn’t have some metric to measure. Otherwise, you have no idea whether the changes made a difference. Although it might be easy to find the easy rewards of performance improvements by making an educated guess, the difference between the metrics will become less and less as the number of iterations increases.
Reconfigure
The reconfiguration phase involves making changes to alleviate the bottlenecks discovered in the Analyze Results phase. Naturally, this can be much harder to accomplish than that simple sentence conveys. And the solution depends on the analysis from the previous step.
Test and Measure
The final step in the circle of performance testing is to test and measure the reconfiguration. The idea behind the iterative nature of performance testing is that it should measurably improve with each cycle. That can be determined empirically only. There is one other element of the test and measurement process that forms a best practice. While going through this process, make only one change at a time. Frequently, while analyzing the results and checking out the application, multiple areas for improvement become visible. However, changing two variables greatly complicates matters. Although it might not seem likely, it’s possible that changing both variables might result in slower performance than changing a single one. The only way to be sure is to keep all variables but one constant for each iteration. It’s ver y easy to put performance testing and improvements into the same categor y as performing magic: much hand waving and a few incantations improve performance. But there are a number of dos and don’ts that can help improve the process.
Stress Testing
Another name for stress testing might very well be reliability testing or load testing. The purpose of stress testing is to create a load on all or part of a component and observe how it functions. Load means multiple users calling the component simultaneously. Stress testing is actually a specialized form of performance testing. It is closer to destructive testing performed in other fields of engineering. In destructive testing, products are taken up to and then past their breaking point to see what happens. In stress testing, a component is inundated with requests and starved for resources to observe how and when the system breaks down.
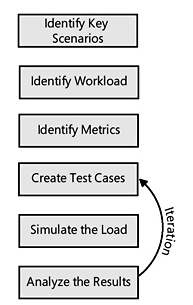
Identify key scenarios The first step in designing a stress test is to identify the areas that are to be tested. In most cases, it is not worth the cost or resources to stress test every part of the application. After running some basic performance tests and examining the application to find potential areas of concern, you can identify a subset of components as stress candidates.
Identify workload For each of the scenarios identified in the first step, the target workload must be defined. For a stress test, you would take the normal and peak transaction rates as a starting point. Then you would increase the amount of work performed by the test, based on projected future rates or some factor that you consider reasonable.
Identify metrics Again, it is not realistic to capture ever y single metric that you can think of on a stress test. Normally, transactions per second and failure rates are the most likely candidates, but additional information should be captured, depending on the type of component being tested. For example, locking contention and connection pools might be of interest if the test includes a database element.
Create test cases Once the scenarios, workload, and metrics have been defined, the next step is to create the test case. This includes writing the code that performs the scenario and any additional code of third-party tools to support the metric collection.
Simulate the load You can choose from a number of options to simulate the load. Thirdparty tools are available to perform this task, for example. If you are running Visual Studio Team System, however, you have access to the Web Testing tool. Along with providing the ability to make a request to a Web server and determine whether the result is expected, Web Testing allows you to invoke the page (or run the script) as if multiple users are calling the page.
What if you want to perform unit tests on non-Web components? The Web Testing tool can help out there as well. From its perspective, a Web test looks very much like a piece of code that is executed, which, not surprisingly, is exactly what a regular unit test looks like. If you direct the Web Testing tool to execute a unit test, it will do so in exactly the same manner as it would a Web page test.
- Analyze the results At this point, you have executed a stress test, complete with metrics. The challenge is to analyze these metrics to determine whether there are any problems or, perhaps more important, just where the breakdown point for your application is.
Evaluating team performance
The calculation of Velocity in physics is pretty straightforward, and if memory serves me correctly, it is the first formula I learned. Simply put:
Velocity = Distance / Time
The Calibration Process
While going through the following Calibration exercise, if your project is affected by Dynamic Forces like those listed above, do not compensate for them in your Velocity calculations. The reason for this is simple: In every Sprint you go through, one or more of these factors will likely raise its ugly head and reduce the Velocity. Some methodologies attempt to compensate for them through calculations. With software developers being the analytical type we tend to be, the temptation to do so can be great, but resist the temptation as in my experience, these calculations introduce additional complexity, with little value. By observing your Velocity averaged over three Sprints as described in the next section, and leaving the effects of Dynamic Forces in your Velocity calculations, you will automatically be developing a Velocity baseline that is biased to implicitly include a Dynamic Force compensation weighting. Indeed, there will be some variability between Sprints, but you should find the weighting to be surprisingly accurate, and most definitely simpler.
Sprint 1
With the changes you’ve made to reduce Friction to moderate the effects of Dynamic Forces, you are ready to start your Calibration. Calibration is fortunately a very simple process, but it takes a bit of time. Calibration is simply observing your Velocity (Units of Effort Completed per Sprint) and adjusting your estimate to match the observed value. There is no formula for this, and there is no right or wrong way to do it. There is also only one objective to the Calibration Process, and that is to use a feedback loop through a Sprint Retrospective to review your Effort Estimates and adjust them so that they are consistent and accurate. The important thing to remember is that you are looking for a consensus from your team so that your team can then use the feedback to create more accurate estimates.
In your Retrospective for your first Sprint, you and your team will examine your Effort estimates for the Sprint and see if you agree as a team that the original Effort estimates were reflective of reality. Remember, that your estimates of Effort are relative. This means that per my previous article, you should find that your results roughly follow as Gaussian distribution. Further, relative sizing between Stories for both Estimate and Actual should be consistent. In other words, if Story A has an Estimated Effort of 5, and Story B has an Estimated Effort of 12, then the Observed Efforts at the end of the Sprint should remain the same relative to each other. If not, change the estimates to align with your newfound insight. Remember, that you and your team are attempting to calibrate or optimize is your ability to assess the Effort of any Story relative to other Stories in your project
The result of this exercise produces a baseline Velocity that represents the Velocity of your team. You may also want to look at Velocity of individual team members, but I find this to be less useful as there are many factors affecting individual velocity i.e. Do you always give the really gnarly problems (the ones no one else can solve) to a specific person, and the really easy ones to someone else. If you do, you may see that the person with the easy problems has a higher velocity than the person with though ones. This is just one of many possible distortions in the measurement of individual Velocity that tend to make individual Velocities less useful.
Once you have completed your Velocity adjustments, and in the same session, I recommend that you jump immediately into doing your Estimates for the next Sprint. Doing so serves two purposes:
The team will get better at estimating Effort because the Calibration exercise will be fresh in their minds. The freshly created baseline becomes the context for your Effort estimates for the next Sprint.
Sprint 2
After you complete your second Sprint, repeat the review process described in Sprint 1 and compare your results to others in both Sprint 1 and Sprint 2. Remembering that you are looking for your Effort estimates and observed results for individual Stories to be consistent relative to all other Stories, you should see significantly less divergence between Estimated and Observed results in your second Sprint. As in your first Sprint, adjust your Estimates to adjust with observed results.
Sprint 3
As in Sprint 2, compare the results the just completed Sprint (3) to the previous Sprint (2), as well as that of Sprint 1. Again, make your adjustments. After the third Sprint, you and your team should feel very comfortable about the ability of your team to deliver consistent Estimates and maintain a constant Velocity. If you think there is still room for improvement or you are struggling, go through an additional iteration. The more iterations you do, the more accurate your baseline will be, but keep in mind there is a law of diminishing returns – three Sprints should be all you need.
Your Velocity
With three Sprints behind you, take the average Velocity across all three Sprints. This is your Team Velocity. By reducing Friction and minimizing unnecessary Velocity changes prior to Calibration, you have optimized the individual and team Velocities. Over the course of the project, and assuming there are no significant factors introduced such as losing a team member, you should observe a very stable Velocity for the duration of the project. Some might say that you should continually try to increase the Velocity of the team – that should be your goal. While developers constantly try to improve their skills, and tools improve, it is unlikely that any of the team members will suddenly become significantly smarter or more productive, or the introduction of a new tool will suddenly make a drastic reduction in effort. If you can continue to reduce Friction or external forces, you may be able to increase Velocity, but remember, you should have gone through that exercise before you began your Calibration exercise. Unless your developers are slacking off (in my experience this is rare), you likely won’t be able to squeeze much more performance out of the individual team members. I am not suggesting that you not attempt to increase Velocity, but if you have done your job properly before you began the Calibration process, you should have already realized most of the gains possible. In addition to improving productivity, the purpose of the Optimization exercise was to obtain Velocity value that is more or less constant so you can begin developing accurate forecasts which is the topic for next week’s article.